Another form of data assimilation is also known as inverse techniques. In this case models are combined with data in a such a way that processes or states not directly measured can be estimated.
In Vallino et al. (2005) we combined our 1D advection dispersion model with dissolved oxygen measurements to estimate gross production and community respiration along the length of the Parker River and PI Sound.
|
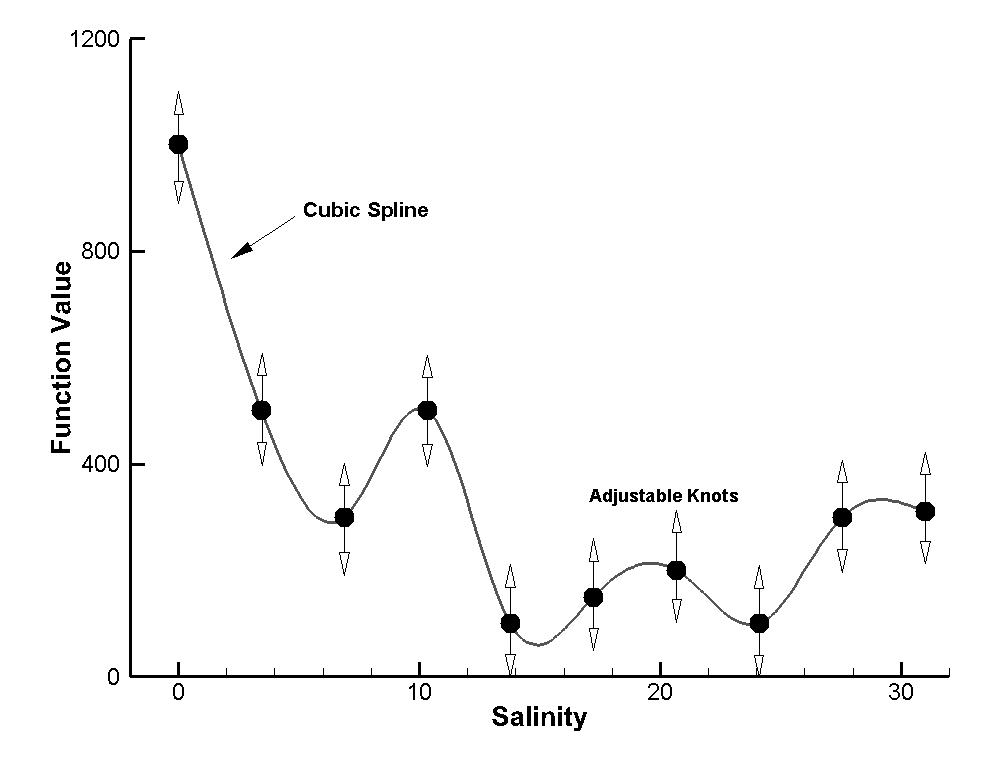
We added dissolved oxygen as a state variable to our 1D ADR model, and introduced two 1D functions to represent gross production and community respiration along the length of the esutary. Production and respiration could then be estimated as a function of location by adjusting the value of the spline knots at a few locations along the estuary. |
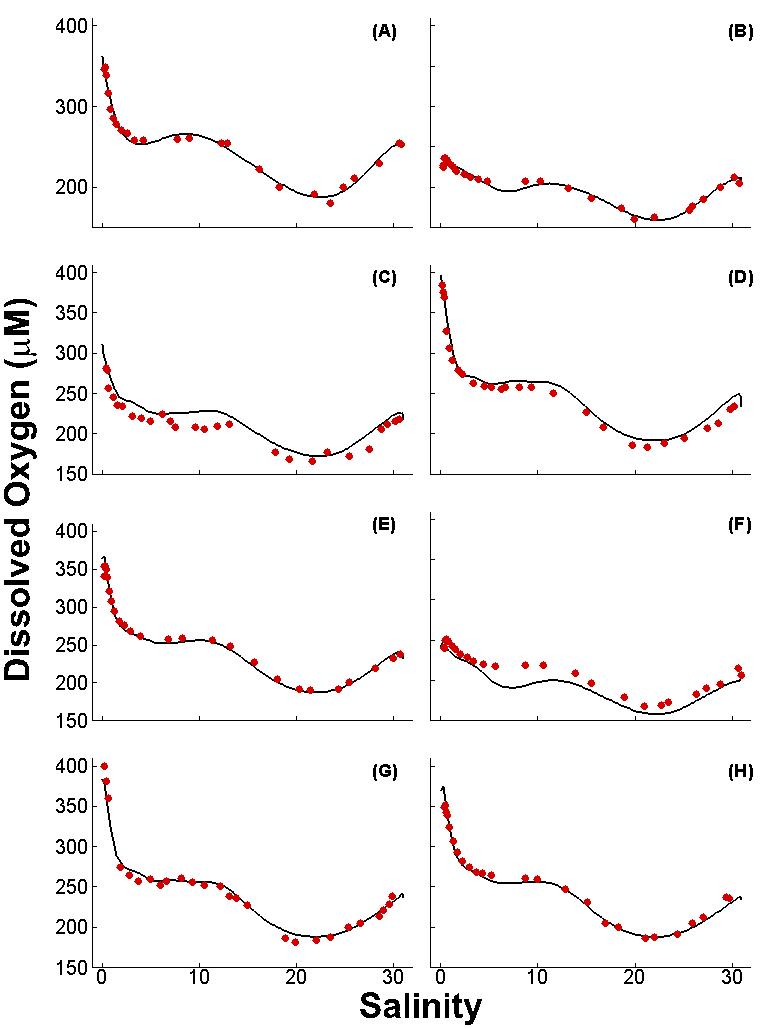 |
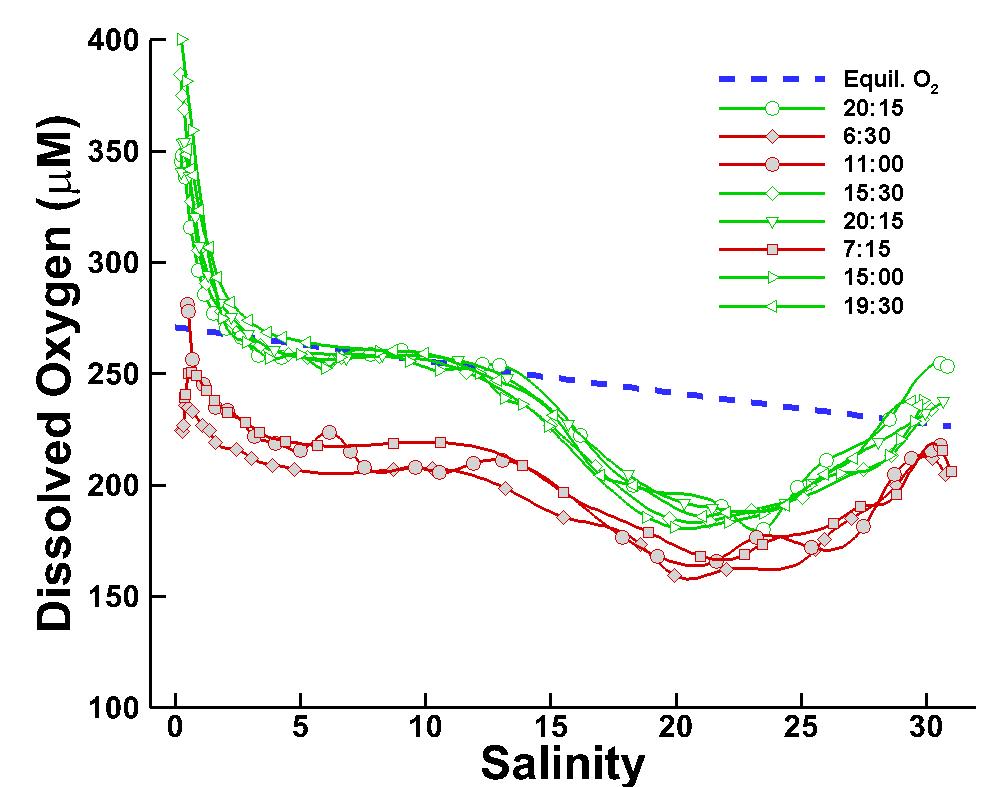
Using our 1D advection-dispersion-reaction (ADR) model, we can simulate DO concentration along the length of the estuary given gross production and community respiration along the length of the estuary. The ADR model also acounts for exchange of oxygen between the air-sea interface based on wind spead and previous research that characterized the oxygen mass transfer velocity for the PIE system. Using data assimilation, the spline knots describing production and respiration (top figure above) were adjusted so that predicted DO matched observed DO. The model fit (black line) to the data (red circles) is shown at left. (Click image for larger figure.) |
| Predicted (A) gross primary production (GPP), (B) community respiration (CR) and (C) net ecosystem production (NEP) over time and salinity space from the ADR model that produce the best matches to the DO transects. Black lines on surfaces correspond to DO transects times conducted (see figures above). In order to extract gross production from community respiration, it is assumed that CR does not change with time over the two day period when DO transects were conducted; however, GPP is assumed to vary as a function of solar radiation intensity as measured by photosynthetic active radiation from the nearby PIE weather station. | 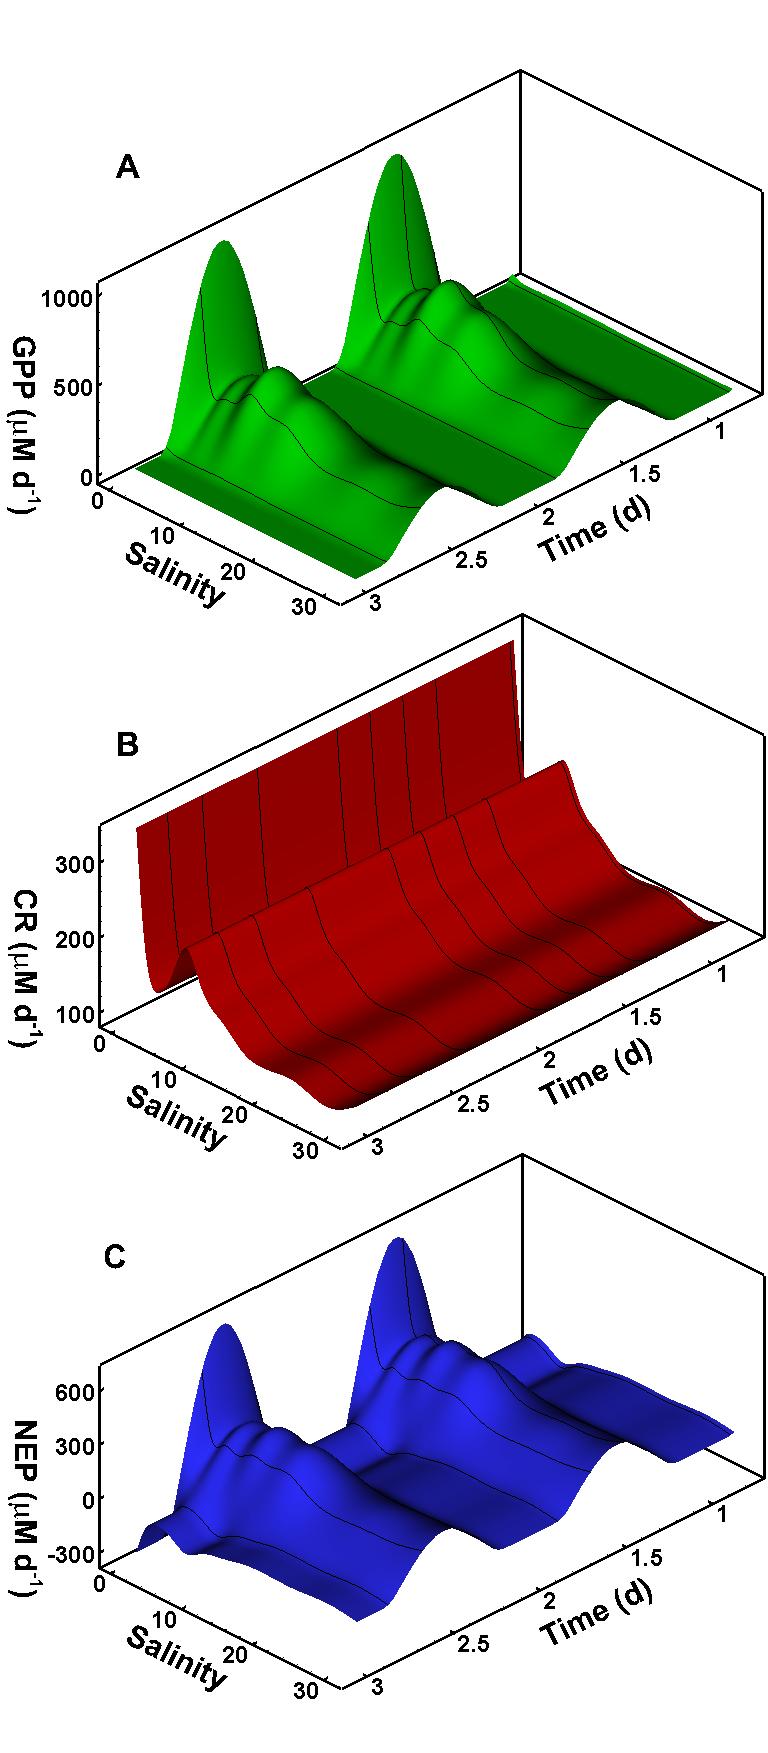 |
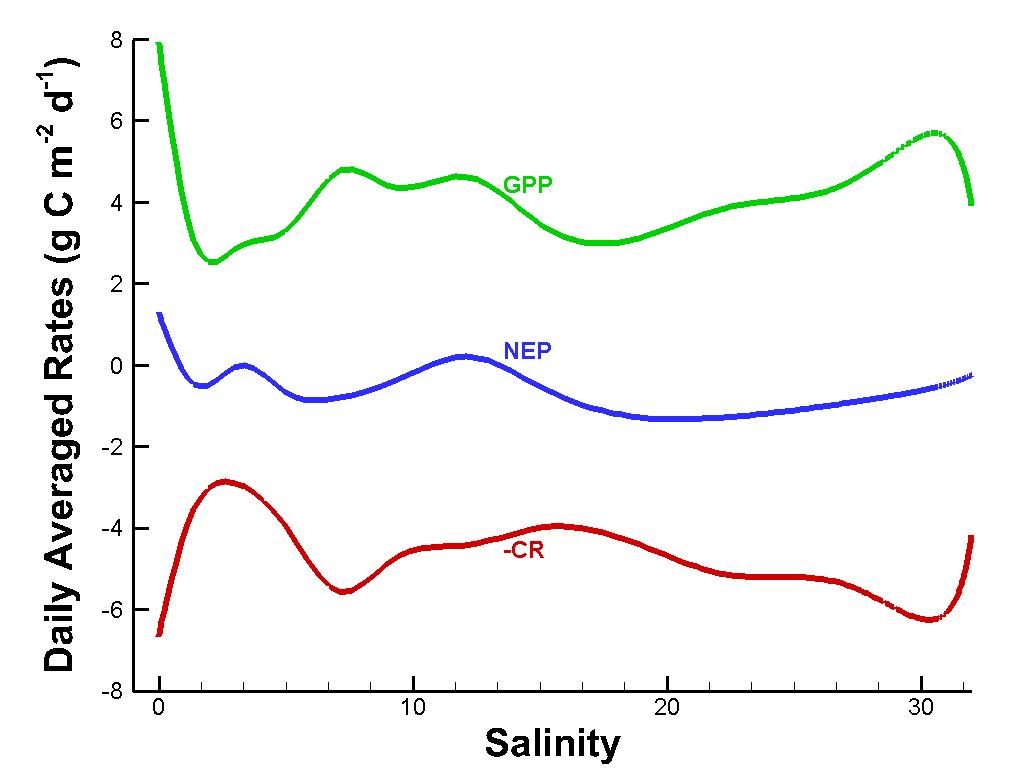 |
Daily averaged GPP, CR and NEP per unit surface area as a function of salinity. Note, results plotted on an areal basis give a misleading interpretation of estuarine NEP in this case because the estuary is much wider at higher salinities. |
| When daily NEP integrated over estuarine cross sectional area is calculated and plotted along estuarine distance (measured from the freshwater end member), it becomes clear that the estuary is net heterotrophic (negative values) because the PI Sound dominates the system due to its much larger volume (width). When integrated over the entire estuary, GPP, CR and NEP equal 48 x 106, 53 x 106 and -4.8 x 10⁶ g C d-1, respectively, for the period of observation. |  |